Applied Price Flow Analysis
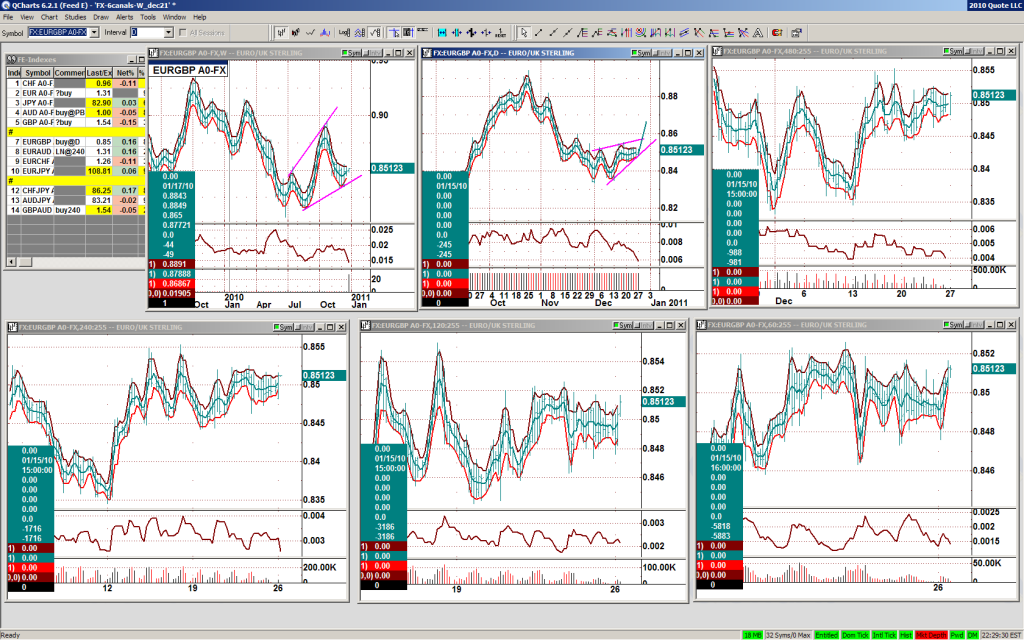
From the charts you will see that:
1. Main flow is at weekly scale and looks like a start of U-turn.
2. Auxiliary flow is at daily scale and looks like an oscillations superimposed on parabolic U-turn.
3. Lower scales don’t have any regular picture.
Conclusion:
If nothing will disturb this situation price flow will go up.
Good entry point (GEP) to open long position.
Stop-loss @ 0.845.
Target (estimated) 0.87.
Limit to buy must be placed at lower side of the channel.


